Scalar fields\Show histogram
Jump to navigation
Jump to search
Menu /Icon
This tool is accessible via the 'Edit > Scalar fields > Show histogram' menu or the ![]() icon in the upper main toolbar.
icon in the upper main toolbar.
Description
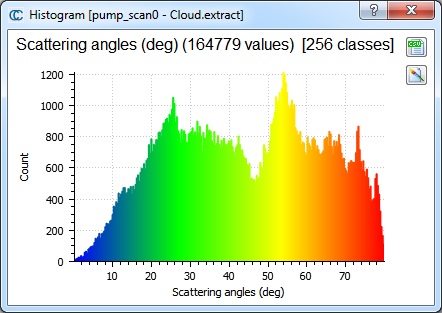
Shows the histogram of the active scalar field of the currently selected entity:
Interactions
- the number of classes (bins) of the histogram can be changed with the mouse wheel.
- the user can click anywhere on the histogram to make a vertical red line appear. Next to this line will be indicated the corresponding class (bin), the percentage of points below this class and the corresponding scalar value.
Colors
The histogram bin colors are the same as the color scale currently associated to the scalar field.
Side buttons
Since version 2.6.2, two buttons are available on the right side:
- Export as CSV: to export the histogram as a CSV file (this can be easily imported in Excel for instance)
- Export as image: to export the histogram as an image
