Facets (plugin)
Introduction
The qFacets plugin can:
- automatically extract planar facets (e.g. fracture planes) from point clouds
- export the facets to SHP files
- classify the facets based on their orientation and their (orthogonal) distance
- display the orientations on a stereogram/stereoplot
- filter the facets (or the points if they have normals) based on their orientation
This plugin has been created and financed by Thomas Dewez, BRGM
To cite this plugin you can refer to this article:
Dewez, T. J. B., Girardeau-Montaut, D., Allanic, C., and Rohmer, J.: FACETS : A CLOUDCOMPARE PLUGIN TO EXTRACT GEOLOGICAL PLANES FROM UNSTRUCTURED 3D POINT CLOUDS, Int. Arch. Photogramm. Remote Sens. Spatial Inf. Sci., XLI-B5, 799-804, doi:10.5194/isprs-archives-XLI-B5-799-2016, 2016.
Alternative link: Research gate.
Usage
Two algorithms are available to extract planar facets.
Extract planar facets with a kd-tree
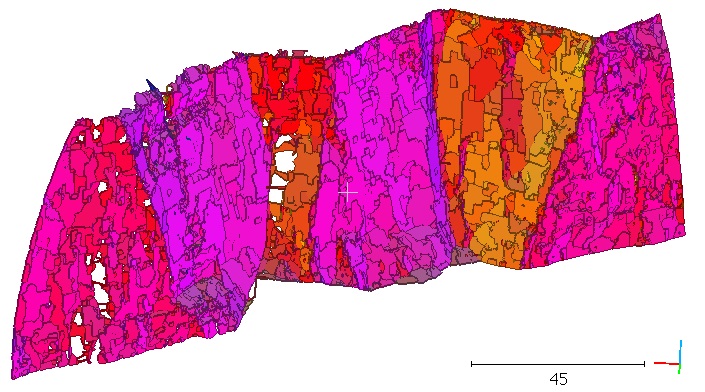
This method relies on a kd-tree to recursively divide the cloud in small planar patches. These planar patches are then regrouped in bigger 'facets'.
To use it, simply highlight the point cloud and click on the ![]() icon.
icon.
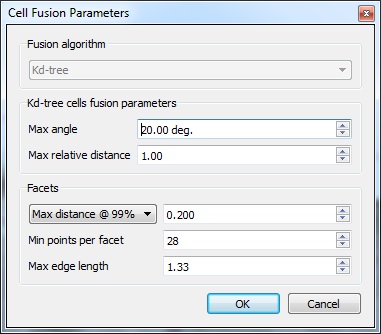
The following parameters dialog will appear:
These parameters are used to conduct the fusion process of the small patches (to create the bigger facets):
- Kd-tree cells fusion parameters:
- Max angle: maximum angle between neighbor patches (in degrees)
- Max relative distance: maximum distance between the merged patches and the current facet center
- Facets frame:
- Distance criterion: this criterion is used to estimate whether a facet is still 'flat' enough after merging a new patch or not. For instance 'Max distance @ 99%' means that 99% of points have to be closer to the value specified in the field on the right (0.2 in the above example)
- Min points per facet: facets smaller than this value will be discarded
- Max edge length: parameter used to extract the facet (concave) contour (the smaller the closer to the points the contour should be)
After clicking on the 'OK' button, CloudCompare will first compute the kd-tree and then it will start the cell fusion process. This second process can be quite long depending on the parameters (especially if many small planar patches are merged in a single facet). However the more it goes the faster it is as there are less and less remaining patches.
Extract planar facets with a Fast Marching
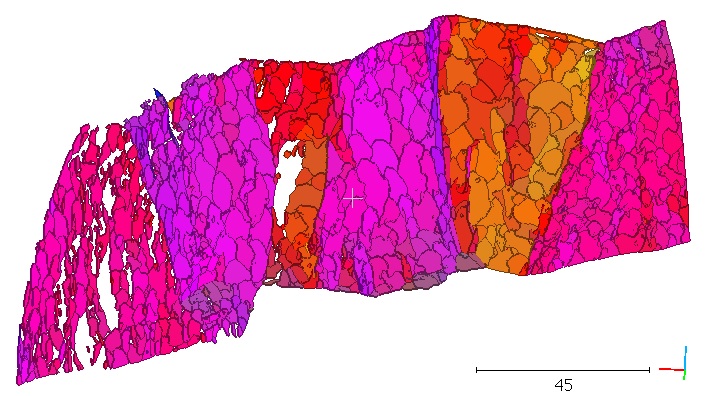
This method resembles the previous one. The idea is once again to divide the input cloud in smaller patches and then to regroup them. This time the subdivision is systematic and not recursive. Therefore all the patches will have almost the same size but some may be very flat while others not (depending on the resolution). And the fusion process is based on a (Fast Marching) front propagation.
To use it, simply highlight the point cloud and click on the ![]() icon.
icon.
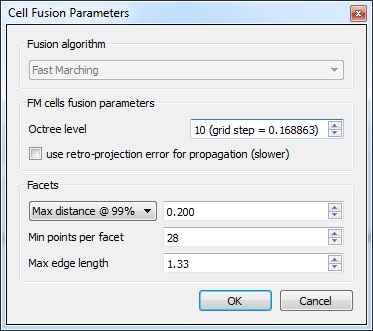
The following parameters dialog will appear:
For the Fast Marching process two parameters can be set by the user:
- the grid resolution (expressed as the subdivision level of the cloud octree as we use the octree for a faster initialization)
- whether to re-compute the facet retro-projection error each time a patch is merged (slower but more accurate)
The 'Facets' frame is the same as the previous algorithm (see above).
Export facets as a SHP file
Once a set of facets has been generated, you can export it as a shape (SHP) file. Simply select the parent container and click on the ![]() icon.
icon.
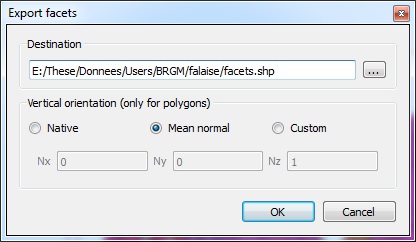
This will make a new dialog appear:
To export the facets to a SHP files, they will first be projected in 2D. To do this a projection direction ('vertical orientation') must be defined. This is the orientation of the 'vertical' vector in the 3D world. You can use:
- the native orientation (i.e. Z = (0,0,1))
- the mean facets normal
- a custom direction (which should be set in the 3 (Nx, Ny, Nz) fields below)
The resulting SHP file will be composed of 2D polygons. The associated DBF file will store various pieces of information for each facet:
- Index
- Center (X,Y,Z)
- Normal (X,Y,Z)
- retro-projection error (RMS)
- Horiz_ext: horizontal extension
- Vert_ext: vertical extension
- Surf_ext: surface of the bounding rectangle (in the facet plane)
- Surface
- Dip direction
- Dip
- Family index (if any - see the Classification method below)
- Sub-family index (if any - see the Classification method below)
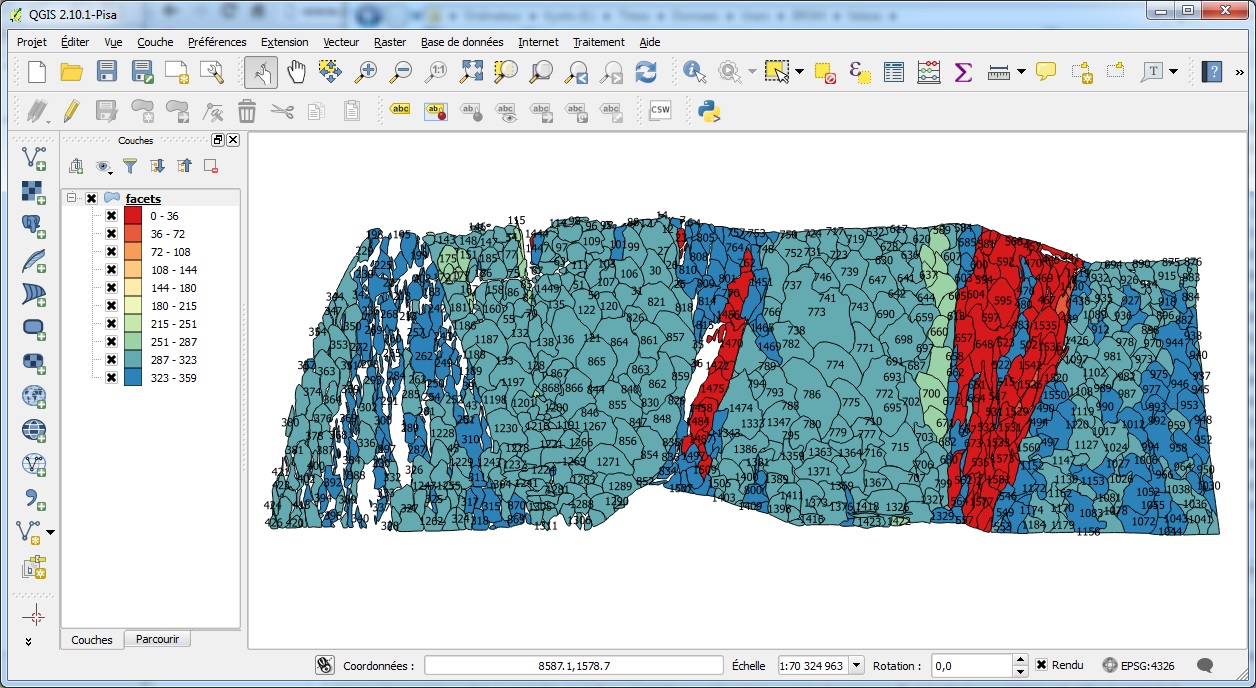
Here is an example of the SHP file imported in QGis:
The colors of the polygons are based on their dip direction and the facets index is used as label.
Export facets as a CSV file
Simply select the parent container of the generated facets and click on the ![]() icon.
icon.
This function works almost the same as the SHP export one (see above). The only difference is that no polygon file will be generated. But the same information as in the DBF file will be saved in a CSV file.
Facets classification
This tool lets you re-organize the generated facets in folders (families) and sub-folders (sub-families) based on their orientation and relative distance.
Select the parent container of the facets and then click on the ![]() icon.
icon.
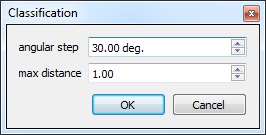
This will display a very simple dialog:
Simply choose:
- each family angular range (they will be regularly sampled starting from 0)
- and the maximum orthogonal distance between facets of a sub-family (this is the orthogonal distance)
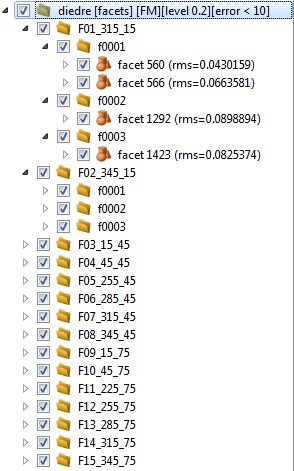
Once validated, the facets will be regrouped in the DB tree (under the same parent container):
The facets will also be colored based on their family (instead of their dip/dip direction).
Stereogram display
The last tool of the qFacets plugin is the stereogram/stereoplot display. To use it you can either select a group of facets or cloud with normals. Then click on the ![]() icon.
icon.
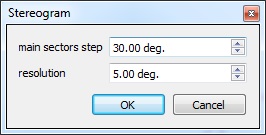
You will have first to define a few parameters for the stereogram plot:
- the angular step for the main sectors
- and the angular resolution (for both the dip and dip direction dimensions)
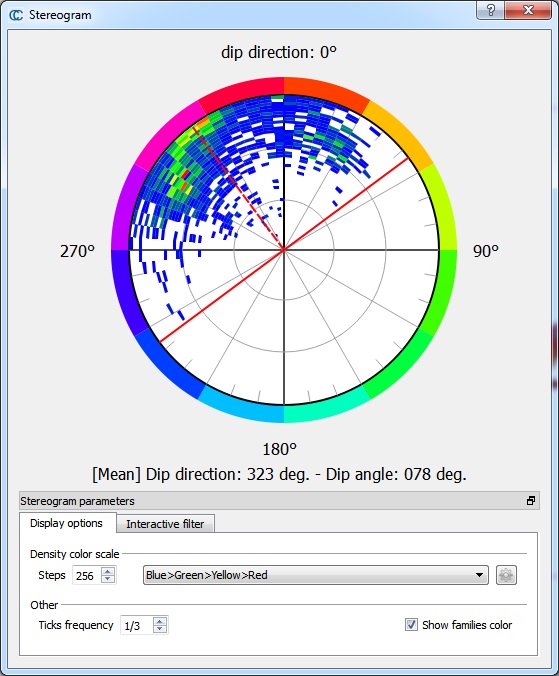
Then the true stereogram will appear:
Display options
The first tab lets you set the display options:
- the color ramp (type and number of steps) - this works just like the scalar fields color ramp (see the Color Scales Manager).
- the small ticks frequency (for each sector)
- and whether to display the families color around the stereogram or not
Interactive filter
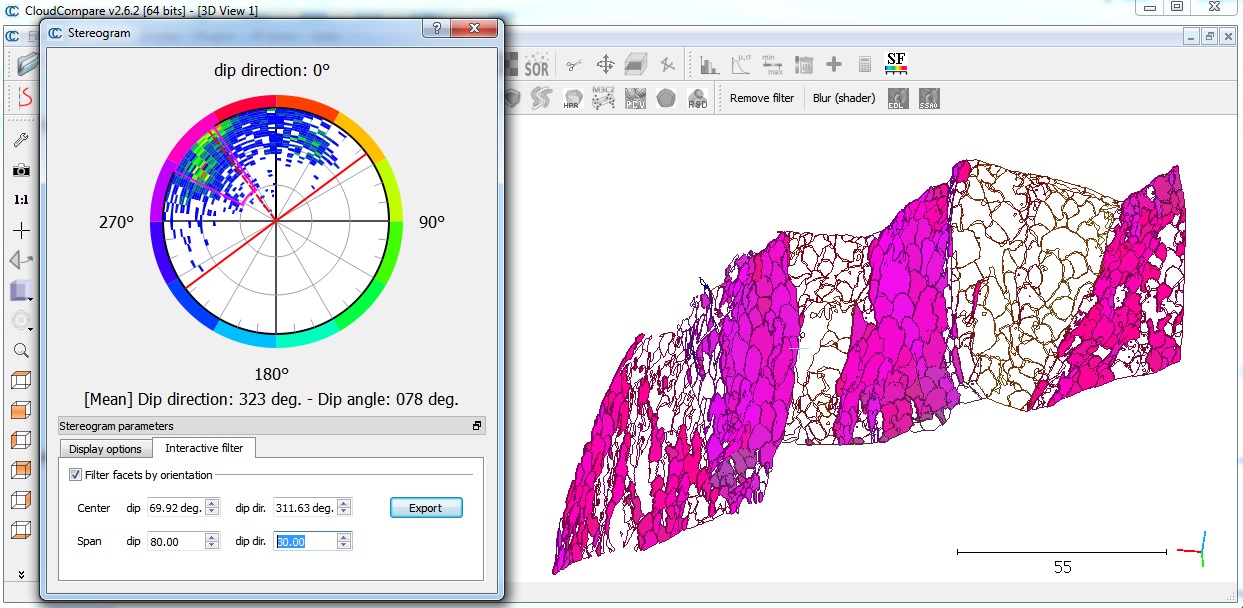
The second tab lets you enable the 'interactive filter'. This filter will let you select an angular range along each dimension (dip and dip direction). Only the facets (or points) falling inside this corresponding section the stereogram plot will be displayed. And this selection can be exported (as a new set of facets or a new point cloud depending on the input entity).
Notes:
- the current selection extents (delimited by red lines) can be re-centered by clicking directly on the stereogram plot
- when visually filtered, the facets polygon will be hidden but their contour will remain visible

