Local Statistical Test
Menu / Icon
This tool is accessible via the 'Tools > Statistics > Local Statistical test' ![]() menu.
menu.
Description
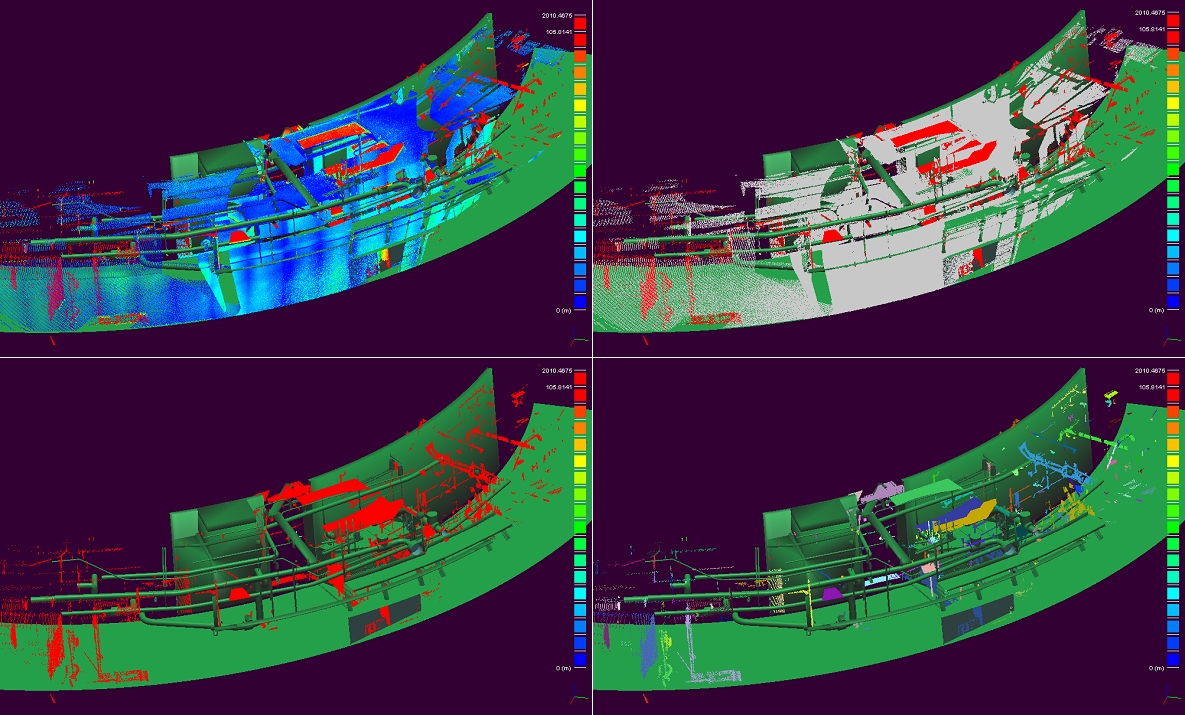
This tool can be used to segment/filter a point cloud based on the local statistical 'behavior' of the active scalar field.
For instance, if the active scalar field corresponds to distances, and you know the distribution of the measurement noise, then you can filter the points for which the local scalar values seem to fit the noise distribution.
This way you'll be able to ignore those points and only focus on the points with distances clearly out of the noise distribution.
Procedure
Select a cloud and start this tool.
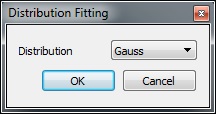
As for the 'Compute Stat Params' tool, CloudCompare will first ask the user to choose the distribution type:
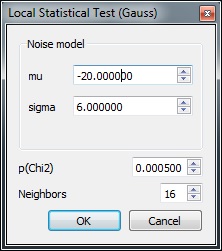
Then another dialog will appear so as to let the user input the distribution parameters as well as the two algorithms parameters:
- p(Chi2): the Chi2 test margin of error (see below for more information)
- Neighbors: the number of neighbors around each point on which to perform the test (at least 10). This algorithm works best on clouds with a homogeneous density.
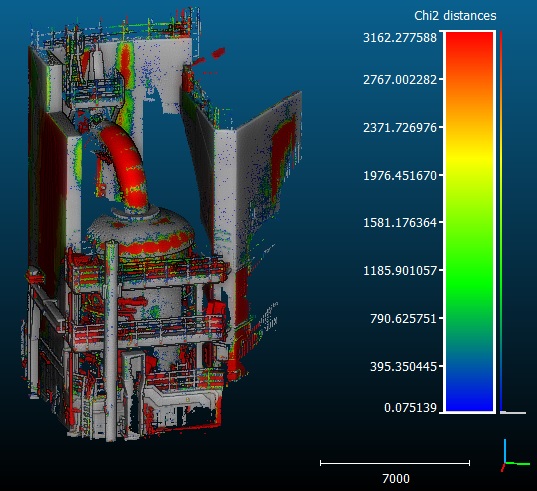
On completion, a new scalar field will be generated on the input cloud: 'Chi2 distances'. CloudCompare will automatically set the 'minimum displayed' and 'minimum saturation' values to the theoretical Chi2 distance that corresponds to the input parameters. This way all the grey points correspond to the points that follow the tested (noise) distribution. The others points are not likely to follow the tested distribution.
Estimating the noise distribution
Let's assume you already have a scalar field associated to your cloud (e.g. distances) but you don't know the noise distribution.
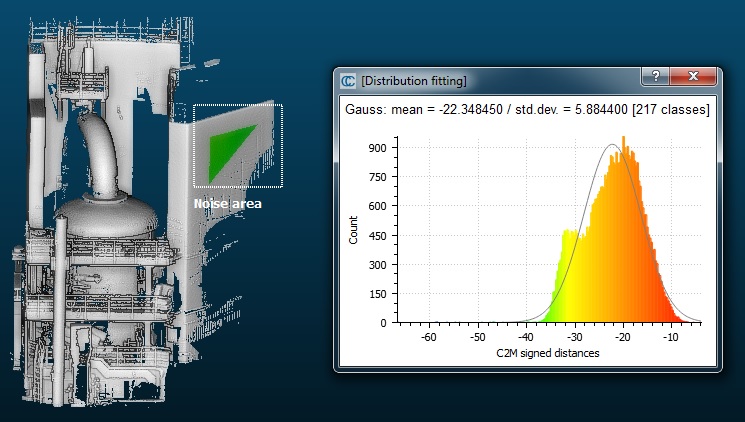
If you can isolate a part of this cloud where the scalar field values should be zero (typically a part that hasn't moved/changed in the case of distances) then you can segment it with the Interactive Segmentation Tool and fit a statistical distribution on the resulting subset's scalar fields with the 'Tools > Statistics > Compute Stat Params' tool:
Warning: if the noise doesn't follow a Gaussian/Normal distribution (for instance if you have computed unsigned distance), then you should prefer the Weibull distribution that has a third parameter and is more versatile.
About the Chi2 test
The Chi2 distance gives an indication on the local concordance between the scalar values (of each point and its neighbors) and the tested distribution. The greater the less likely is the local distribution likely to follow the tested one.
The margin of error (p) is only used to set the threshold below which points will be considered as being 'in concordance' with the tested distribution. The smaller this margin, the less discriminating the test will. As this test is used to "reject the hypothesis that the local scalar values' follow the tested distribution". Therefore if the margin is smaller than this hypothesis will be less rejected and more points will be considered as being compatible with the tested distribution! (e.g. noise).
Exploiting the Chi2 distances
The user can directly use the 'Edit > Scalar fields > Filter by Value' method in order to extract and create a new cloud with the non-grey points (the points which distance is significant for instance). This tool will use the current display parameters by default.
And from the filtered cloud you can extract Connected Components for instance:
